
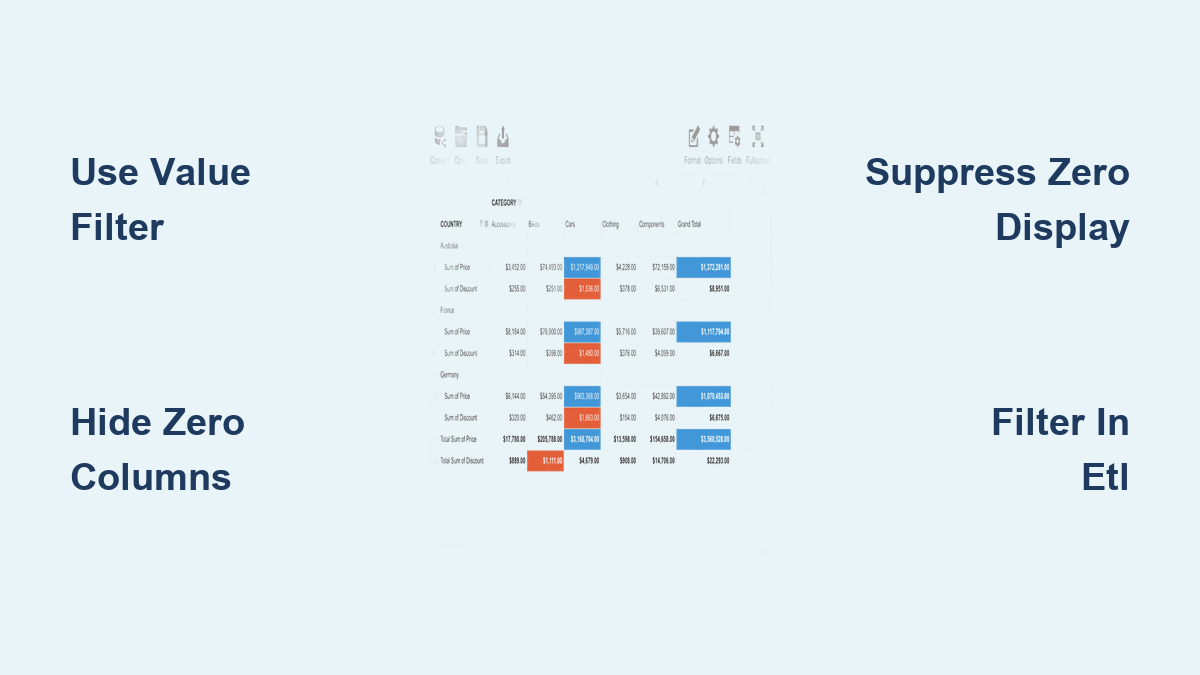
How to Remove Zeros From a Pivot Table
Nothing clutters a pivot table faster than rows and columns filled with zeros. Whether you’re analyzing sales data, tracking expenses, or summarizing performance metrics, zero-value entries can obscure meaningful insights and make reports harder to read. The good news? You don’t need to clean your source data. You can remove these zeros directly within the pivot table, keeping your original dataset intact while delivering a cleaner, more focused analysis.
This guide shows you exactly how to remove zeros from a pivot table in Microsoft Excel, Qlik Sense, and advanced BI tools like Domo or SAP BW. We’ll cover step-by-step methods, common mistakes, and platform-specific tricks so you can eliminate visual noise and highlight only the data that matters.
Excel: Filter Out Zero Values with Value Filters

The fastest way to remove zero values in Excel is through Value Filters, which let you dynamically exclude rows based on aggregated totals. This method works for any numeric field in the Values area, such as Sum of Sales or Total Bonus.
Apply Not Equal to Zero Filter
- Click any cell inside the pivot table’s value column, like a number under Sum of Sales.
- Right-click and choose Filter, then Value Filters, and select Not Equal To.
- In the dialog box that appears, select the correct field from the first dropdown, such as Sum of Sales.
- Set the condition to does not equal and enter 0 in the value field.
- Click OK.
This hides all rows where the total equals zero. The filter persists when you refresh the data, so your clean view stays intact.
Use Report Filter to Exclude Zeros Manually
If you prefer a toggle-style control on your report, duplicate the value field into the Filters area.
- In the PivotTable Field List, drag the same field from VALUES to FILTERS.
- A dropdown will appear above the pivot table.
- Click the filter arrow and uncheck the box next to 0.
- Click OK.
Now you can turn zero suppression on or off with one click, ideal for presentations or interactive dashboards.
Excel: Fix Display and Calculation Issues with Zeros
Sometimes zeros appear due to formatting or calculation quirks, not actual data. Here’s how to tell the difference and fix it.
Suppress Zero Display Without Removing Rows
To hide zeros visually without removing rows, change Excel’s pivot table options.
- Right-click the pivot table.
- Go to PivotTable Options, then Layout and Format.
- Check For empty cells, show and leave it blank.
- Uncheck Show items with no data if needed.
This hides blanks and formats zeros as empty, but it does not remove rows with actual zero values. Use this only for cosmetic cleanup.
Avoid Filtering Calculated Fields Incorrectly
Calculated fields like Profit equal Revenue minus Cost may return zero even when inputs exist. If you filter out zero, you might accidentally hide valid records.
Audit your formula logic. Consider using a threshold like greater than 0.01 instead of not equal to zero to avoid dropping near-zero results.
Qlik Sense: Suppress Zero Columns by Dimension

In Qlik Sense, zero suppression happens at the dimension level, not the value filter. This is key when dealing with pivot tables showing multiple measures like quarterly sales.
Hide Zero-Only Columns
- Click the dimension header, such as Quarter, in your pivot table.
- Open the Properties panel.
- Expand the Limitations section.
- Toggle on Suppress Zero Values.
Any column where all measures are zero or null will be removed from view. For example, if Q1 has zero sales across all regions, the entire Q1 column disappears.
Combine with Include Zero Values Setting
Qlik Sense has two separate settings. Include Zero Values controls whether zero entries appear within the table. Suppress Zero Values in Limitations removes full columns or rows of zeros.
Turn off Include Zero Values and enable Suppress Zero Values for maximum cleanup. If the option is missing, check your Qlik Sense version. Older builds may require script-level filtering.
Advanced BI: Remove Rows Where All Values Are Zero
In tools like Domo, Power BI, or SAP BW, you may need custom logic to remove rows where every column is zero, especially when negatives could cancel out positives.
Use Beast Mode to Flag Zero Rows
Create a calculated field that checks if the sum of all values is zero.
- Add a new calculated field using this logic:
– Sum the absolute values of all measure columns
– If the total equals zero, flag as Exclude
– Otherwise, flag as Include - Apply a filter to show only Include.
Using ABS prevents false positives. A row with plus 50 and minus 50 sums to zero but contains real data. Wrapping values in absolute value functions ensures only true zero-impact rows are excluded.
Alternative: Square Values Before Summing
Square each value before summing, then check if the total equals zero. This achieves the same result as ABS but uses a different mathematical approach.
Pre-Filter in ETL for Cleaner Data
For better performance and consistency, filter out zero rows during data preparation rather than in the visualization layer.
Filter Rows in Magic ETL or Power Query
- Pivot the data first if needed.
- Add a Filter Rows step.
- Set the condition to check if all relevant columns equal zero.
- Remove rows matching this condition.
- Load the cleaned dataset into your pivot.
This approach offers faster dashboard load times and cleaner logic in the visualization layer. It works across all BI platforms and is ideal for large datasets where real-time filtering slows performance.
Common Mistakes When Removing Zeros from Pivot Tables
Even experienced users make errors when trying to remove zeros. Avoid these pitfalls.
Filtering Row Labels Instead of Values
You cannot remove zero-sum rows by filtering product or region names. The filter must target the aggregated numeric field, such as Sum of Sales. Always use Value Filters in Excel or apply logic to the measure, not the dimension.
Ignoring Negative Values
A row with plus 100 and minus 100 sums to zero, but it is not an empty row. Blindly filtering where SUM equals zero removes meaningful data.
Use SUM of ABS Value greater than zero to ensure only true zero-impact rows are excluded.
Manual Source Data Cleaning
Sorting or filtering source data before building a pivot table is inefficient. Every refresh requires repeating the process.
Use pivot-native filters or ETL logic instead. Both update automatically and require no manual intervention.
Best Practices for Clean, Zero-Free Pivot Tables

Follow these guidelines to keep your pivot tables sharp and insight-ready.
Focus on Active Data
Remove zeros to highlight high-performing regions, active customers, and meaningful trends. This prevents analysis paralysis caused by irrelevant entries.
Optimize for Performance
Large Excel files slow down when rendering thousands of rows. Filtering out zeros reduces the visible row count, prevents hitting row limits, and speeds up recalculations.
Use Power Pivot or Power Query for datasets over 100,000 rows.
Ensure Data Integrity
Before suppressing zeros, confirm that zeros are intentional and not missing data coded as zero. Verify that nulls and zeros are correctly interpreted.
Use conditional formatting to audit zero patterns first.
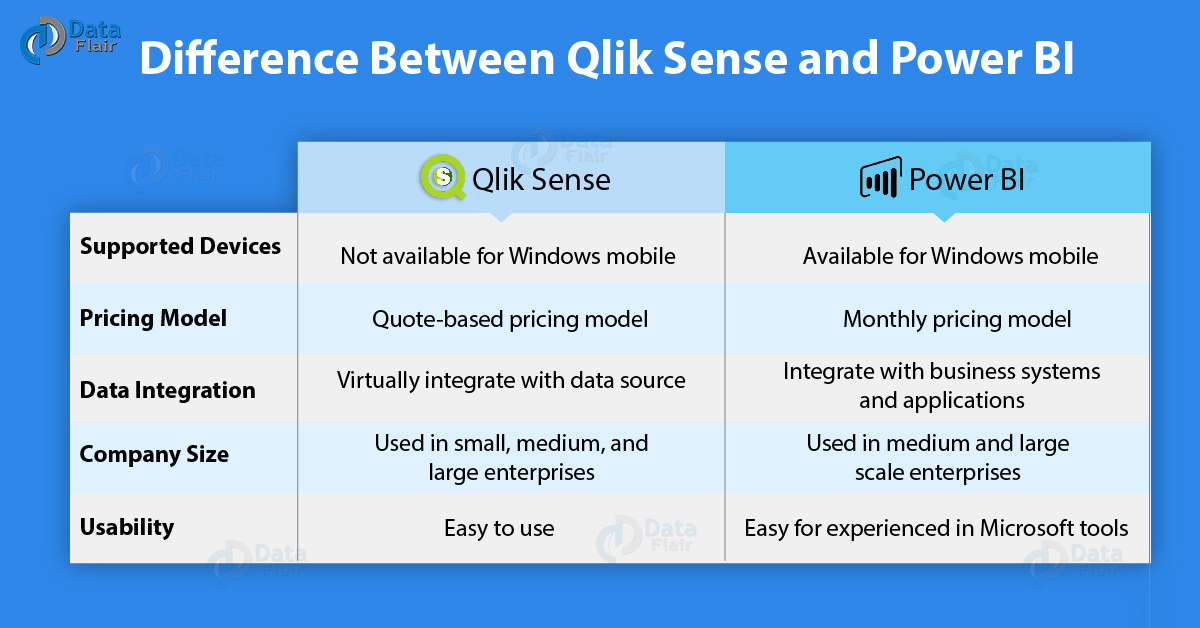
Platform Comparison for Removing Pivot Table Zeros
| Method | Tool | Best For | Difficulty |
|---|---|---|---|
| Value Filter not equal to 0 | Excel | Quick row removal | Low |
| Report Filter uncheck 0 | Excel | Interactive dashboards | Low |
| Dimension Suppression | Qlik Sense | Hide zero-only columns | Medium |
| Beast Mode or SQL Logic | Domo, Power BI | Row-wide zero detection | High |
| ETL Pre-Filter | Magic ETL, Power Query | Large datasets | High |
Frequently Asked Questions About Removing Zeros from Pivot Tables
How do I remove zero rows in Excel pivot tables?
Use the Value Filter feature. Click any cell in the value column, right-click, choose Filter, then Value Filters, and select Does Not Equal. Enter 0 in the value field and click OK. This hides all rows where the total equals zero.
Can I remove zeros without changing my source data?
Yes. All methods described work at the pivot table or visualization layer, leaving your source data untouched. The filters update automatically when you refresh the data.
Why do zeros still appear after applying a filter in Excel?
You may be filtering the wrong field. Ensure you are filtering the aggregated numeric field in the Values area, not the row labels. Also check if the zeros are from calculated fields with logic that returns zero for valid entries.
How do I remove zeros in Qlik Sense pivot tables?
Click the dimension header, open the Properties panel, expand Limitations, and toggle on Suppress Zero Values. This removes columns where all measure values are zero or null.
What if my pivot table has both positive and negative numbers that sum to zero?
Use absolute value logic. In custom calculations or ETL, wrap each value in ABS or square the values before summing. This ensures rows with mixed positive and negative numbers are not incorrectly filtered out.
Does removing zeros improve pivot table performance?
Yes. Filtering out zeros reduces the number of rendered rows, which decreases calculation time and prevents hitting row limits in large datasets. This is especially important in Excel files approaching 100,000 rows.
Key Takeaways for Removing Zeros from Pivot Tables
Knowing how to remove zeros from a pivot table is not just about aesthetics. It is about clarity, performance, and accurate analysis. Whether you are using Excel’s intuitive Value Filters or writing custom logic in a BI tool, the goal remains the same: eliminate noise and focus on what matters.
Apply these platform-specific techniques to create leaner, faster, and more impactful reports. Filter at the pivot or ETL level rather than relying on manual cleanup of your source data. This ensures your reports update automatically and maintain data integrity over time.
Start by identifying where zeros appear in your current reports, choose the appropriate method for your tool, and implement the filter. Your future self and your refresh button will thank you.