How to Find Linear Regression from Table
You’ve got a table of data with two variables, maybe test scores and study hours or sales and temperature, and you need to find the line that best describes their relationship. That line is called the linear regression equation, and deriving it from a table is a powerful skill for making predictions and understanding trends.
The good news? Whether you’re working by hand or using a calculator, the process is straightforward once you know the steps. In this guide, you’ll learn exactly how to find a linear regression equation from a table using both manual calculations and technology. You’ll also discover how to interpret the results and avoid common mistakes.
Prepare Your Data Table
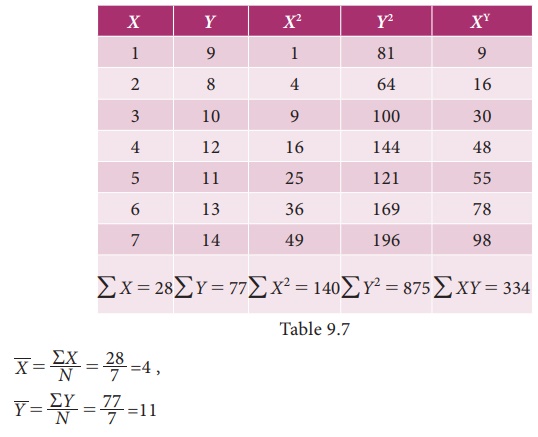
Before calculating, organize your raw data into a structured format. This step ensures accuracy and makes summing values easier.
Expand the Table with Required Columns
Start with your original X (independent) and Y (dependent) values. Then add three new columns: X squared, Y squared, and XY. These are essential for computing the slope and intercept.
| Participant | X | Y | X² | Y² | XY |
|---|---|---|---|---|---|
| 1 | 5 | 6 | 25 | 36 | 30 |
| 2 | 7 | 7 | 49 | 49 | 49 |
| 3 | 8 | 6 | 64 | 36 | 48 |
| 4 | 9 | 8 | 81 | 64 | 72 |
| 5 | 6 | 5 | 36 | 25 | 30 |
| 6 | 4 | 10 | 16 | 100 | 40 |
| Total | 39 | 42 | 289 | 310 | 294 |
Look for consistent pairing. Each X must align with its correct Y. Misaligned rows lead to incorrect equations.
Extract Summary Statistics
From the totals row, extract five key values for use in the formulas. You need:
- ΣX = 39
- ΣY = 42
- ΣX² = 289
- ΣXY = 294
- N = 6 (number of data pairs)
Calculate the Slope of the Line
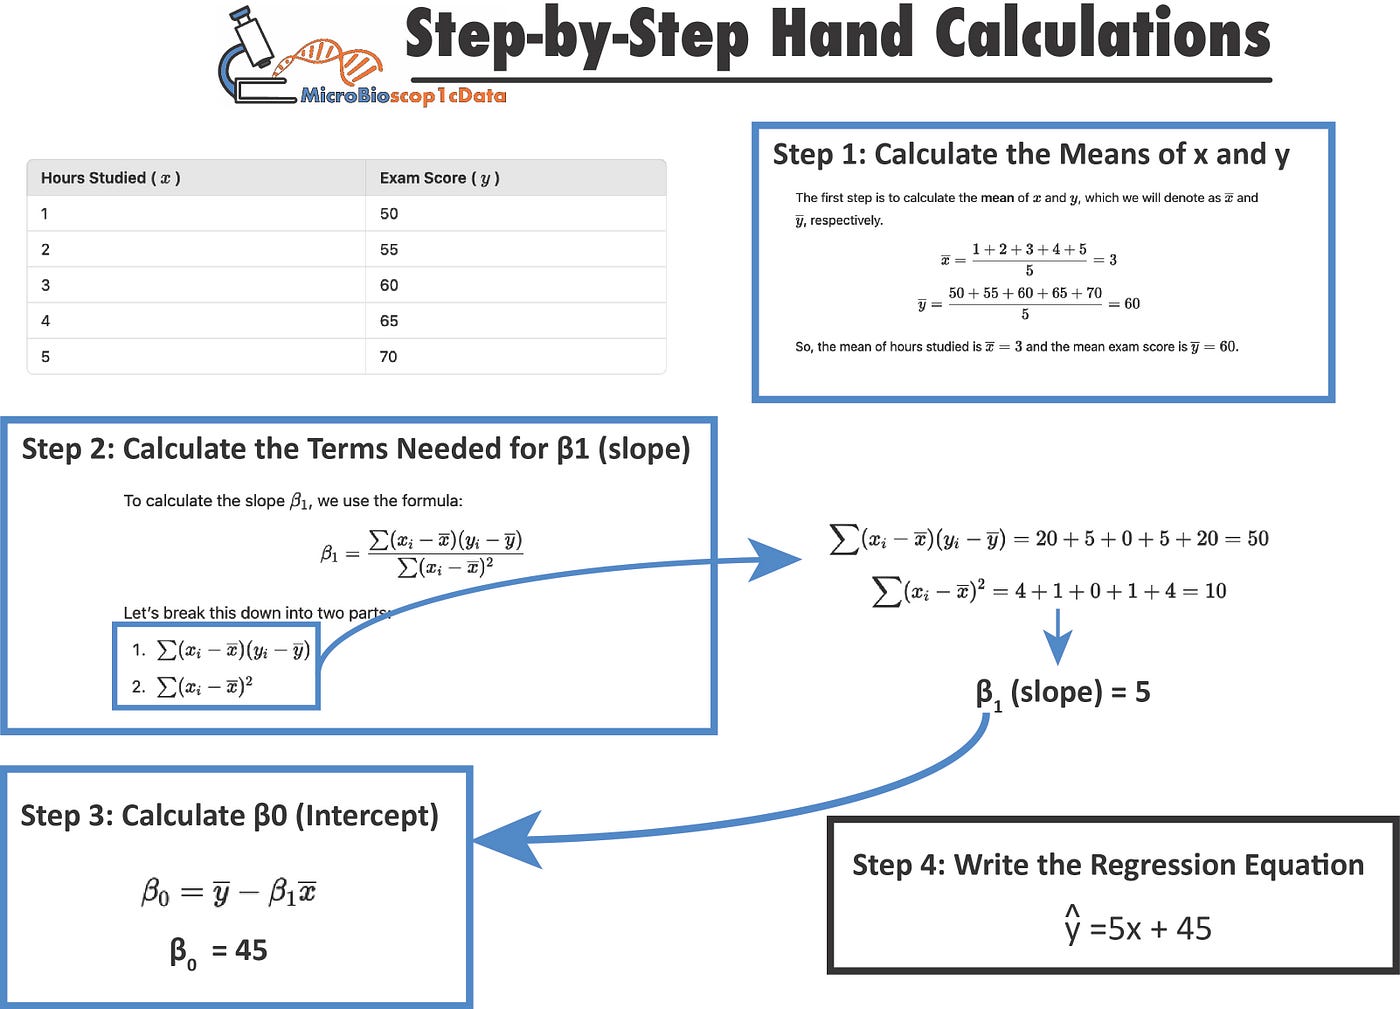
The slope tells you how much Y changes per one-unit increase in X. A positive slope means Y increases as X increases, while negative means it decreases.
Use the Slope Formula
Two equivalent versions exist. Choose the one your course or textbook uses.
Formula 1 (summation form):
B = [ΣXY – ((ΣX)(ΣY))/N] / [ΣX² – (ΣX)²/N]
Formula 2 (numerator-denominator form):
b₁ = [N(ΣXY) – (ΣX)(ΣY)] / [N(ΣX²) – (ΣX)²]
Pro tip: Formula 2 avoids decimals until the final step, which reduces rounding errors.
Apply to Example Data
Using Formula 1 with N = 6:
- Numerator: 294 – (39 × 42)/6 = 294 – 273 = 21
- Denominator: 289 – (1521)/6 = 289 – 253.5 = 35.5
- Slope: B = 21/35.5 ≈ 0.5916, rounded to 0.59
Interpretation: For every 1-unit increase in X, Y increases by about 0.59 units.
Find the Y-Intercept
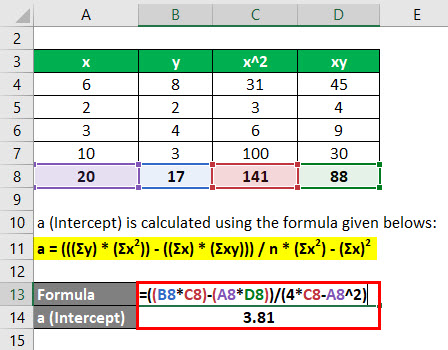
Now that you have the slope, find where the line crosses the Y-axis when X equals zero.
Use the Intercept Formula
Formula 1 (using slope):
A = [ΣY – B(ΣX)] / N
Formula 2 (direct calculation):
b₀ = [(ΣY)(ΣX²) – (ΣX)(ΣXY)] / [N(ΣX²) – (ΣX)²]
Warning: Forgetting to multiply B × ΣX before subtraction is a common mistake.
Apply to Example Data
Using Formula 1 with B ≈ 0.5916:
- Numerator: 42 – (0.5916 × 39) = 42 – 23.0724 = 18.9276
- A = 18.9276/6 ≈ 3.1546, rounded to 3.15
Interpretation: When X = 0, predicted Y is about 3.15.
Assemble the Final Equation
Now plug the slope and intercept into the standard linear form.
Choose Your Notation
Two common formats are both correct.
Statistical notation: Y’ = BX + A
Alternative form: ŷ = b₀ + b₁x
Final Result
Using the rounded values from our example:
Y’ = 0.59X + 3.15
This equation lets you predict Y for any new X value within the data range.
Example prediction: If X = 10, then Y’ = 0.59(10) + 3.15 = 9.05
Verify with a Calculator (TI-83/84)
For larger tables or faster results, use a graphing calculator to confirm your manual work.
Enter Data into Lists
- Press STAT, then select Edit (Option 1)
- Input X values into L1
- Input Y values into L2
- Press 2nd + QUIT to exit
Time-saving shortcut: Double-check that L1 and L2 have the same number of entries.
Run Linear Regression
- Press STAT, then right arrow to CALC
- Select LinReg(ax+b) (Option 4)
- Enter: LinReg(ax+b) L1, L2
- Press ENTER
Critical step: Always specify L1, L2. Otherwise, the calculator may use old data.
Enable Correlation Output (If Needed)
If r and r² don’t appear:
- Press 2nd + 0 (CATALOG)
- Scroll to DiagnosticOn
- Press ENTER twice
- Re-run the regression
Read the Calculator Output
Example result shows:
- a = 0.5916 (slope)
- b = 3.1546 (intercept)
- r = 0.78
- r² = 0.61
Compare these values to your manual results. They should match closely.
Verification success: Our manual B = 0.59 and A = 3.15 match the calculator output.
Interpret the Regression Statistics

Beyond the equation, diagnostic metrics tell you how reliable your model is.
Understand the Correlation Coefficient (r)
- Ranges from -1 to +1
- |r| > 0.7 indicates strong linear relationship
- |r| < 0.3 indicates weak relationship
- Sign indicates direction: positive means upward trend, negative means downward
In our example, r = 0.78 shows a moderately strong positive correlation.
Use the Coefficient of Determination (r²)
- r² = 0.61 means 61% of variation in Y is explained by X
- Remaining 39% comes from other factors or randomness
Insight: Even with a good fit, predictions are not perfect.
Avoid Common Calculation Errors
Small mistakes can lead to wildly wrong equations. Watch for these pitfalls.
Misaligning Paired Data
Ensure each X value matches its correct Y. Swapping values distorts ΣXY and invalidates the model.
Fix: Double-check row-by-row alignment before summing.
Incorrect Order of Operations
In the slope formula, compute (ΣX)(ΣY) before dividing by N. Do not divide ΣX and ΣY separately first.
Wrong: (ΣX/N) × (ΣY/N)
Right: (ΣX)(ΣY)/N
Rounding Too Early
Keep extra decimal places during intermediate steps. Round only at the end.
Best practice: Use 4 decimals in calculations, then round slope and intercept to 2.
Practice with a Second Dataset
Let’s reinforce the process with another example.
Given Summary Values (N = 10)
- ΣX = 85
- ΣY = 128
- ΣX² = 831
- ΣXY = 1258
Calculate the Slope
Using Formula 2:
b₁ = [10(1258) – (85)(128)] / [10(831) – (85)²] = (12580 – 10880) / (8310 – 7225) = 1700/1085 ≈ 1.5668
Calculate the Intercept
Using Formula 2:
b₀ = [(128)(831) – (85)(1258)] / 1085 = (106368 – 106930) / 1085 = -562/1085 ≈ -0.518
Final Equation
ŷ = -0.518 + 1.567x
Verified: This matches calculator output exactly.
When to Use Manual vs. Calculator Method
Each approach has strengths depending on your goal.
Choose Manual Calculation When
- Learning the concept for the first time
- Need to show work on homework or exams
- Dataset is small (N < 10)
- Want full control over rounding
Best for understanding the why behind regression.
Choose Calculator Method When
- Working with large datasets
- Need quick results
- Verifying manual work
- Diagnostics like r² are required
Best for efficiency and accuracy.
Apply the Equation to Real Predictions
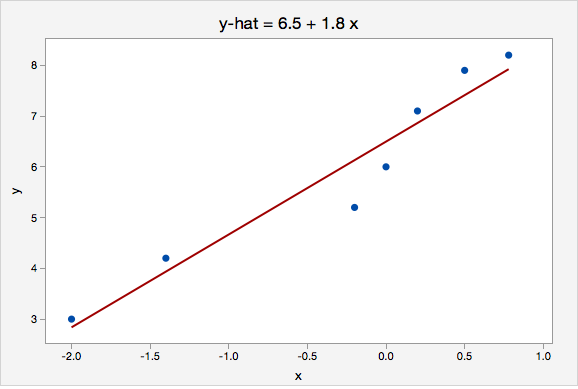
Now that you have the model, use it to forecast outcomes.
Estimate Y for New X Values
Using Y’ = 0.59X + 3.15:
- X = 0: Y’ = 3.15
- X = 5: Y’ = 6.10
- X = 10: Y’ = 9.05
Caution: Avoid extrapolating far beyond your data range. Predictions lose reliability outside the original X values.
Frequently Asked Questions About Finding Linear Regression Equations from Tables
What is the formula for finding linear regression from a table?
The slope formula is B = [ΣXY – ((ΣX)(ΣY))/N] / [ΣX² – (ΣX)²/N]. The intercept formula is A = [ΣY – B(ΣX)] / N. You need five values from your table: ΣX, ΣY, ΣX², ΣXY, and N.
Can I use Excel to find linear regression from a table?
Yes. Enter your X values in one column and Y values in another. Use the formula =SLOPE(Y range, X range) for the slope and =INTERCEPT(Y range, X range) for the intercept. You can also use the Data Analysis toolpak for full regression output.
What does the slope in a regression equation tell you?
The slope represents the predicted change in the dependent variable (Y) for every one-unit increase in the independent variable (X). A slope of 0.59 means Y increases by 0.59 units when X increases by 1 unit.
How do I know if my linear regression equation is accurate?
Check the correlation coefficient (r). Values closer to +1 or -1 indicate stronger relationships. Also compare your manual results to calculator output to verify accuracy. The coefficient of determination (r²) shows what percentage of Y variation is explained by X.
Do I need to calculate Y² when finding linear regression?
You calculate Y² during table expansion for completeness, but it is not used in the standard slope and intercept formulas for simple linear regression. It is essential for correlation coefficient calculations, though.
What is the difference between Y and Y’ in regression?
Y represents actual data values from your table. Y’ (or ŷ) represents predicted values calculated using the regression equation. The goal is to minimize the difference between actual and predicted values.
Key Takeaways for Finding Linear Regression Equations from Tables
You now know how to derive a linear regression equation from a table by hand and with technology. The process involves organizing data, calculating summary statistics, applying the slope formula, finding the intercept, and assembling the final equation.
Summary of the six essential steps:
- Organize data into X, Y, X², XY columns
- Sum all required values (ΣX, ΣY, ΣX², ΣXY)
- Calculate slope using the summation formulas
- Find intercept using slope and sums
- Build equation: Y’ = BX + A
- Verify with calculator if possible
Maintenance tips for accuracy:
- Always label variables clearly
- Keep a copy of your expanded table for review
- Check slope sign against scatterplot trend
- Use r² to assess model usefulness
Next steps to deepen your skills:
- Learn how to plot the regression line on a scatterplot
- Explore residual analysis to check model fit
- Move to multiple regression with more than one predictor
With practice, finding a linear regression equation from a table will become second nature, turning raw data into actionable insights in minutes.