
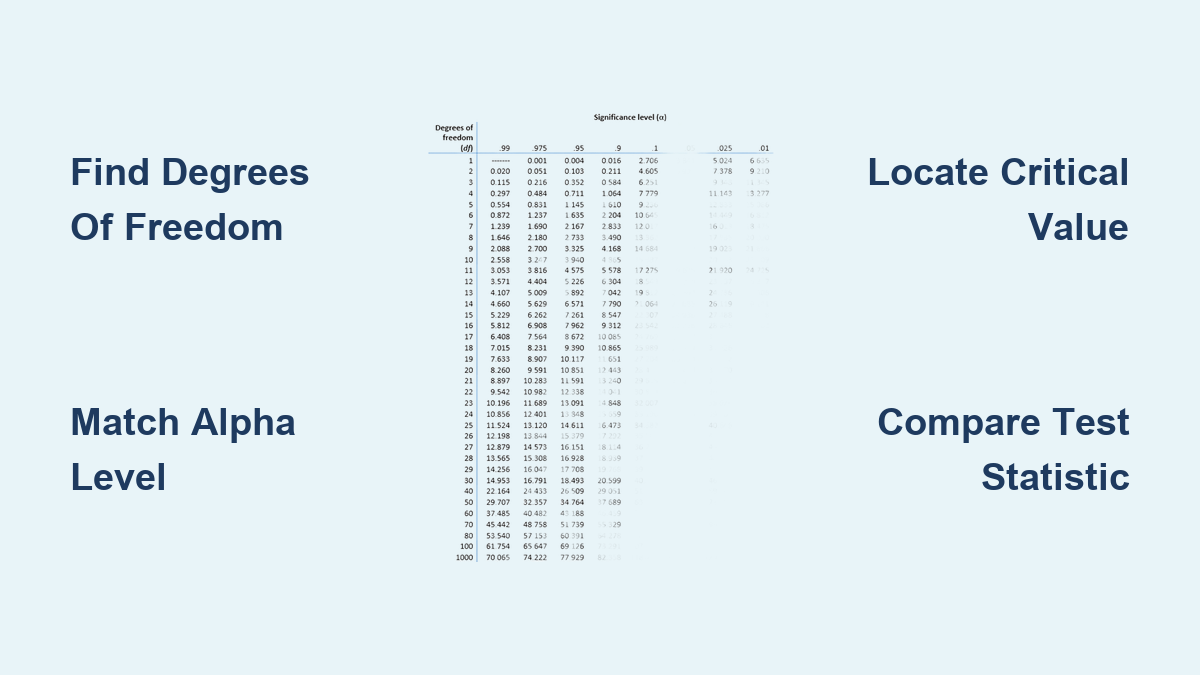
How to Use a Chi Square Table
You’ve calculated your chi-square test statistic, but now you’re staring at a table full of numbers wondering what to do next. This is one of the most common sticking points in statistics. The chi-square table provides critical values that tell you whether your results are statistically significant, but only if you know how to read it correctly. Unlike statistical software that spits out exact p-values instantly, the chi-square table requires you to understand degrees of freedom, significance levels, and how to match your specific test to the right values.
This guide walks you through every step of using a chi-square table for hypothesis testing. You’ll learn how to find critical values, calculate degrees of freedom for any test type, estimate p-values when you need more than a yes or no answer, and avoid the mistakes that trip up even advanced students. By the end, you’ll be able to perform chi-square analysis completely offline.
Find the Critical Value
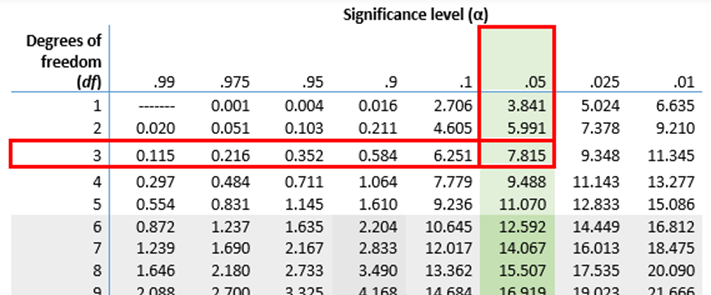
The critical value is your threshold for significance. Comparing your calculated test statistic to this number tells you whether to reject or fail to reject the null hypothesis.
Match Degrees of Freedom and Alpha
Every chi-square table requires two inputs to find the right number. First, locate your degrees of freedom along the left side of the table in the rows. Second, find your significance level, called alpha, across the top in the columns. Common alpha values are 0.05, 0.01, and 0.10. Where your df row meets your alpha column, you’ll find the critical value.
For example, if you’re running a test with 2 degrees of freedom at alpha equals 0.05, you would look at row 2 and column 0.05. The intersection gives you 5.991. This is your threshold.
Use the Right Tail for Rejection
Chi-square tests are always right-tailed, meaning large test statistics lead to rejecting the null hypothesis. Your calculated chi-square value must exceed the critical value to be significant. If your test statistic is 7.2 and your critical value is 5.991, then 7.2 exceeds 5.991, so you reject the null hypothesis. If your test statistic is 4.1 instead, then 4.1 is less than 5.991, and you fail to reject.
Always confirm you’re reading the upper tail values. The chi-square distribution has no negative values, and left-tail entries would give you incorrect conclusions.
Calculate Degrees of Freedom
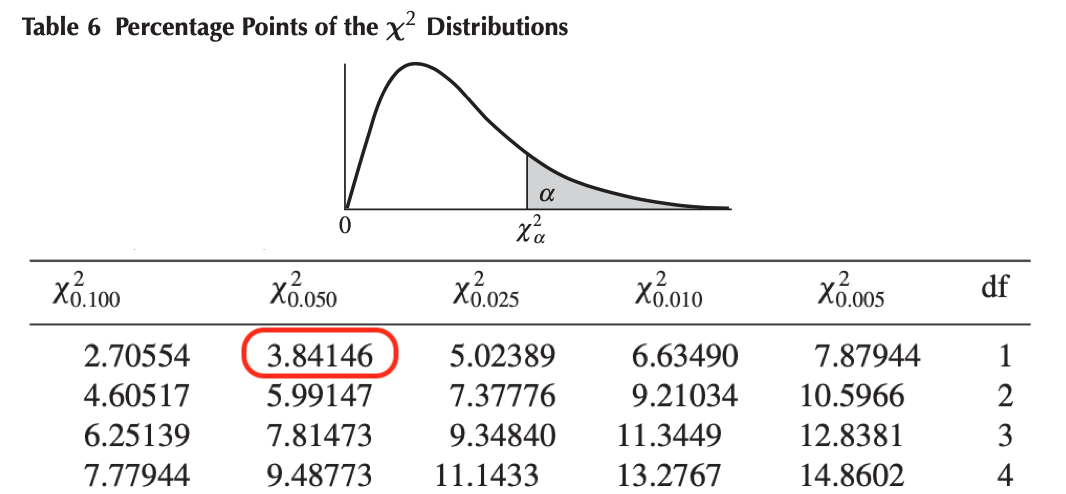
Your degrees of freedom determine which row to use in the table. Using the wrong formula leads directly to wrong answers, so getting this step right is essential.
Goodness of Fit: Subtract One
For a goodness-of-fit test, you compare observed frequencies to expected frequencies across categories. The formula is straightforward: df equals k minus 1, where k is the number of categories. Testing whether M&M colors match expected proportions with 6 colors means df equals 6 minus 1, giving you 5. Testing customer traffic across Friday, Saturday, and Sunday means df equals 3 minus 1, giving you 2.
Independence or Homogeneity: Multiply Minus Ones
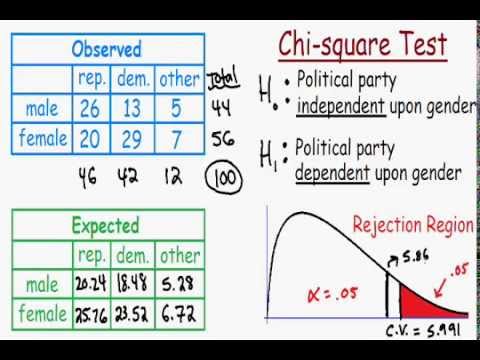
For contingency table tests, whether you’re checking for independence between two variables or homogeneity across groups, the formula is df equals r minus 1 times c minus 1. Here, r is the number of rows and c is the number of columns. Analyzing gender across three political parties with 2 rows and 3 columns gives you (2-1)(3-1), which equals 1 times 2, giving you 2 degrees of freedom.
Read the Table Correctly
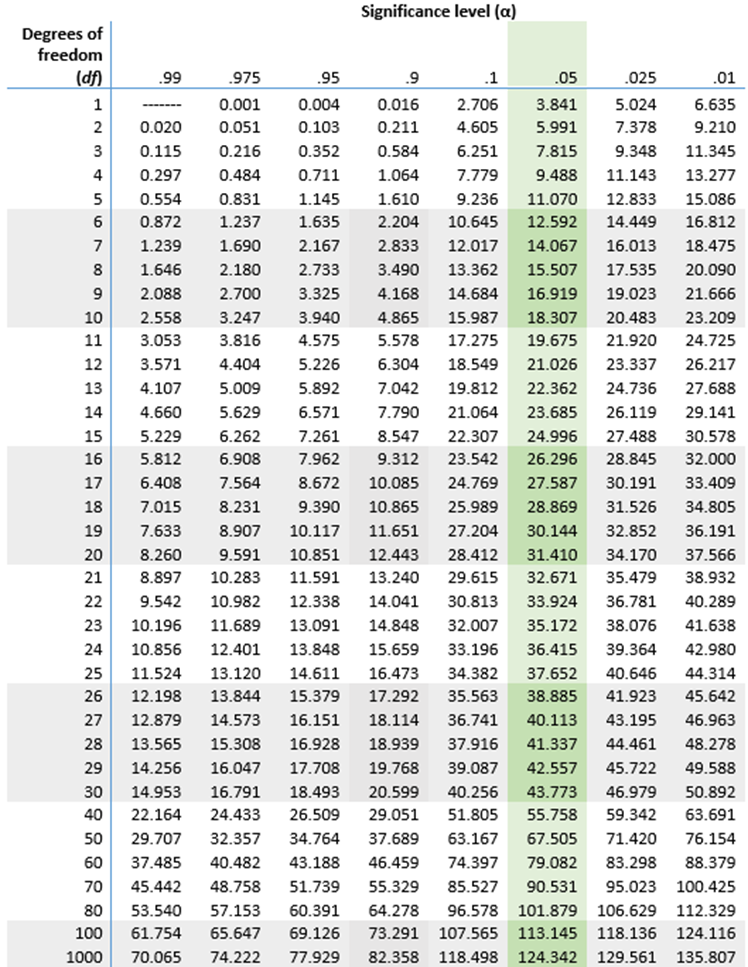
Understanding what the numbers actually represent removes the mystery from table lookup and builds confidence in your results.
Locate Rows and Columns Fast
Standard chi-square tables display degrees of freedom in ascending order down the left side, typically running from 1 to 100 or beyond. The top row shows significance levels, usually in descending order from 0.10 or 0.50 down to 0.001. Find your df, scan across to your alpha column, and you have your critical value. No interpolation or calculation is needed for the critical value approach.
Know What the Number Means
The critical value represents the minimum chi-square statistic needed to reject the null hypothesis at your chosen alpha level. Higher degrees of freedom require larger chi-square values to achieve significance because the distribution shifts right and becomes less skewed. Lower alpha levels require larger critical values because you’re demanding stronger evidence before rejecting.
| Degrees of Freedom | α = 0.05 | α = 0.01 |
|---|---|---|
| 2 | 5.991 | 9.210 |
| 5 | 11.070 | 15.086 |
| 10 | 18.307 | 23.209 |
Notice how both columns increase as degrees of freedom grow. This reflects the changing shape of the chi-square distribution.
Estimate P-Values from the Table
Sometimes knowing just whether you can reject isn’t enough. When you need to estimate the actual p-value, the table provides enough information to bracket your result.
Bracket Your Test Statistic
Start by finding your degrees of freedom row. Instead of going directly to one alpha column, scan across the entire row to find the two critical values that your test statistic falls between. Note the alpha levels associated with those two values. Your p-value lies between those two alpha levels.
For instance, with 5 degrees of freedom and a chi-square statistic of 8.2, you might find that 7.29 corresponds to a certain upper-tail probability while 9.24 corresponds to another. Since 8.2 falls between these values, your p-value falls between those two probabilities. If 8.2 is closer to 9.24, your p-value is closer to the alpha level associated with 9.24.
Compare Estimated P to Alpha
Once you have your estimated p-value range, decision-making becomes simple. If your estimated p is less than alpha, reject the null hypothesis. If it’s greater, fail to reject. With alpha equals 0.05 and an estimated p between 0.10 and 0.20, since 0.15 is greater than 0.05, you would fail to reject the null hypothesis.
This method gives you more information than the critical value approach alone, showing you how strong or weak your evidence actually is.
Apply to Real Examples
Seeing these steps applied to actual problems solidifies understanding and builds confidence for your own analysis.
Test for Independence: Gender vs Party
A researcher wants to know whether gender relates to political party preference among 500 voters. Gender has 2 categories and party has 3, giving df equals (2-1)(3-1) equals 2. Using alpha equals 0.05, the critical value from the table is 5.991. The calculated chi-square statistic is 0.864. Since 0.864 is less than 5.991, the result is not significant. There is insufficient evidence to conclude that gender and party preference are associated.
Goodness of Fit: Store Customer Days
A shop owner claims customers distribute as 30% Friday, 50% Saturday, 20% Sunday. Observed counts are 91 Friday, 104 Saturday, 65 Sunday, totaling 260. With 3 categories, df equals 3 minus 1 equals 2. Using alpha equals 0.10, the critical value is 4.605. The calculated chi-square is 10.616. Since 10.616 exceeds 4.605, the result is significant. The customer distribution does not match the owner’s claim.
Homogeneity: Training Program Pass Rates
Three basketball training programs are compared to see if pass rates differ. With pass/fail as 2 rows and 3 programs as 3 columns, df equals (2-1)(3-1) equals 2. At alpha equals 0.05, the critical value is 5.991. The calculated chi-square is 4.208. Since 4.208 is less than 5.991, there is no significant difference in pass rates among the three programs.
Avoid Common Mistakes
Small errors here can completely flip your conclusion. Stay alert to these pitfalls that catch many students.
Wrong Tail or Alpha
Chi-square tests always use upper-tail probabilities. Never look at lower-tail values unless you’re specifically constructing a two-tailed confidence interval, which is rare and requires splitting your alpha in half. Using alpha equals 0.05 means finding where 5% of the distribution falls in the right tail, not the left.
Misidentifying Degrees of Freedom
Using k minus 1 for a contingency table inflates your degrees of freedom and lowers your critical value, making you more likely to falsely reject the null hypothesis. Always apply the correct formula for your test type. Goodness of fit uses k minus 1. Independence and homogeneity use (r-1)(c-1).
Misreading P-Value Direction
Remember that larger chi-square values correspond to smaller p-values. If your statistic falls between the critical values for alpha equals 0.05 and alpha equals 0.01, your p-value falls between 0.01 and 0.05, not the other way around. The relationship is inverse.
Know When to Use the Table
While software gives exact p-values instantly, the table remains essential in several important situations.
Ideal for Manual Analysis
The chi-square table shines when technology isn’t available. Students taking exams without calculators or statistical software need this skill. Field researchers conducting quick checks away from computers benefit from table proficiency. Teachers use the table to reinforce understanding of how significance actually works, building intuition that software-only learners miss.
Complements Software Use
Even when you have technology, checking a printed table helps verify software output and deepens your understanding. Seeing that your chi-square of 10.6 far exceeds 5.991 at df equals 2 confirms strong evidence against the null hypothesis. It also helps you communicate results to others who may not have software access.
Frequently Asked Questions About Using a Chi-Square Table
What if my degrees of freedom isn’t in the table?
Most tables include values up to 100 degrees of freedom. If your df exceeds the table limit, you can approximate using the fact that the chi-square distribution approaches normality as df increases. For intermediate values not listed, some tables include interpolation instructions.
Can I use the chi-square table for small sample sizes?
The chi-square test is generally not recommended when expected frequencies in any cell fall below 5. The approximation may be unreliable. Consider Fisher’s exact test or combining categories instead.
Why does my textbook sometimes show different critical values?
Different textbooks may use slightly different table conventions. Some show upper-tail probabilities while others show the cumulative area to the left. Always verify which type your table displays before using it.
How do I handle two-tailed chi-square tests?
Two-tailed tests are uncommon but require splitting your alpha. Use alpha divided by 2 for the upper tail and look up the lower tail separately if constructing a confidence interval. Most introductory statistics courses focus on one-tailed tests.
What’s the difference between the critical value method and p-value method?
The critical value method gives you a simple reject or fail to reject decision based on a predetermined alpha. The p-value method estimates the probability of observing your data assuming the null hypothesis is true, giving you more nuanced information about the strength of your evidence.
Key Takeaways for Using a Chi-Square Table
Mastering the chi-square table gives you a reliable backup method for hypothesis testing anywhere, anytime. The three essential steps are calculating degrees of freedom correctly using the right formula for your test type, matching your df and alpha to find the critical value, and comparing your test statistic to that threshold to make your decision.
Practice with varied examples across goodness-of-fit, independence, and homogeneity tests to build speed and confidence. Whether you’re preparing for an exam, working in the field, or verifying software results, this skill remains fundamental to statistical analysis. Start with simple tables and progressively tackle more complex scenarios to become proficient.