How to Use a Binomial Table: Simple Guide
You’re staring at a binomial probability table, trying to find the chance of getting exactly 3 heads in 7 coin flips, but the numbers look confusing and you’re not sure where to start. You are not alone. Many students and professionals struggle with interpreting these tables, especially when they encounter different formats or tricky wording like “at least” or “more than.” The good news is that once you understand the structure and logic behind binomial tables, they become a fast, reliable tool for solving real-world probability problems without complex calculations.
This guide will show you exactly how to read and use a binomial table step by step. Whether you are working on statistics homework, preparing for an exam, or analyzing success rates in quality control, you will learn how to extract the right values, avoid common mistakes, and apply the correct formulas based on your question type.
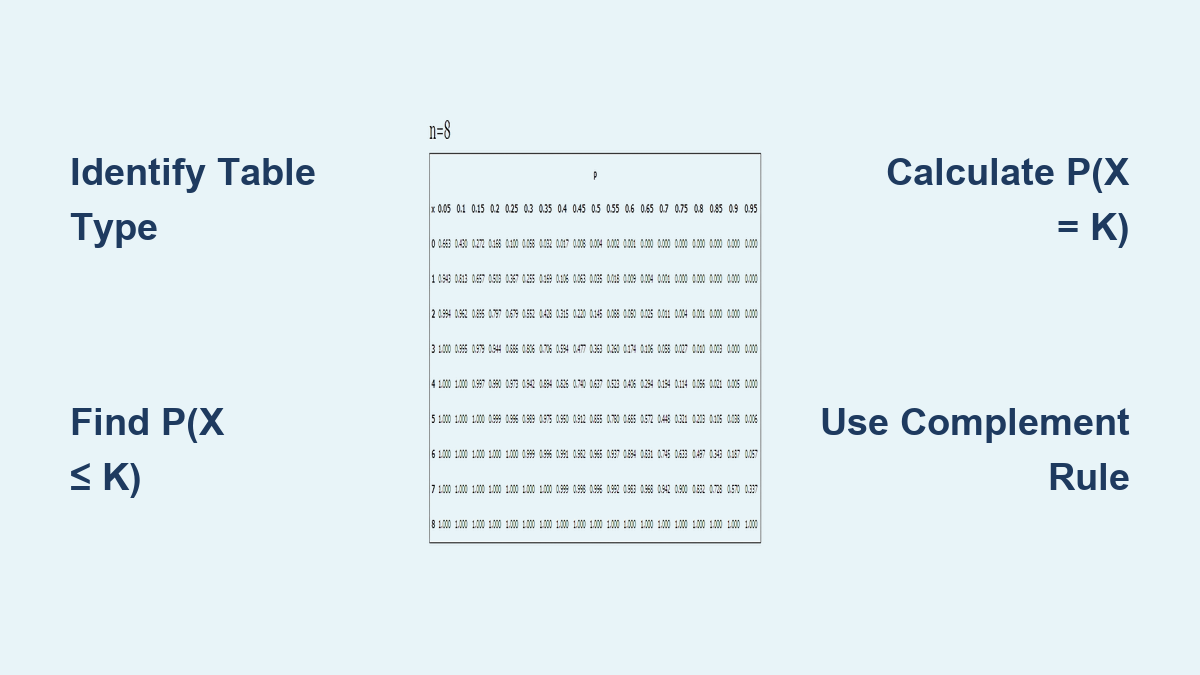
Identify Your Table Type
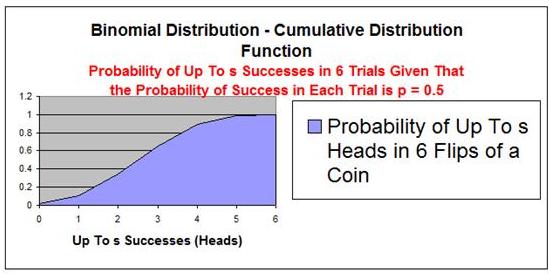
Before using any binomial table, you must determine its format. The three main types are:
Cumulative Probability Tables
These are the most common. They show the total probability of getting k or fewer successes. For example, the entry for k=3 includes the sum of probabilities for 0, 1, 2, and 3 successes.
Look for:
• Headers like P(X ≤ x)
• The word “Cumulative”
• Phrases like “Less than or equal to”
Individual Probability Tables
These list the probability of getting exactly r successes. Each cell gives a single value, not a sum.
Look for:
• Headers like P(X = r)
• The word “Exact” or “Individual”
Upper-Tail Tables
Less common but used in specialized contexts. These give the probability of r or more successes.
Look for:
• P(X ≥ r)
• Phrases like “at least”
Pro Tip: Always check the table title or footnote. Misreading the type leads to wrong answers even with correct math.
Find P(X ≤ k): At Most k Successes
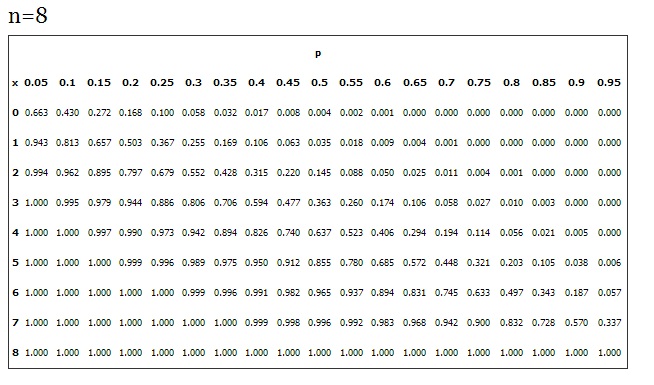
This is the simplest use of a cumulative binomial table.
Locate n, p, and k
- Find the section for your number of trials (n).
- Go to the column matching your success probability (p).
- Move down to the row for your target number of successes (k).
- Read the value at the intersection.
Example:
Suppose n = 5, p = 0.20, and you want P(X ≤ 3), the chance of 3 or fewer successes.
• Find the table for n = 5
• Locate column p = 0.20
• Find row k = 3
• Value: 0.993
So there is a 99.3% chance of 3 or fewer successes.
This method works only with cumulative tables. If your table shows individual probabilities, you would need to add P(0) + P(1) + P(2) + P(3) manually.
Calculate P(X = k): Exactly k Successes

Cumulative tables do not list exact probabilities directly. You must subtract two values.
Use the Formula
- Look up P(X ≤ k)
- Look up P(X ≤ k-1)
- Subtract the second from the first
Example:
For n = 5, p = 0.30, find P(X = 4)
• P(X ≤ 4) = 0.998
• P(X ≤ 3) = 0.969
• 0.998 – 0.969 = 0.029
So the chance of exactly 4 successes is 2.9%.
Common Mistake: Using P(X ≤ k) directly as the answer for “exactly.” This overestimates the probability.
Solve P(X ≥ k): At Least k Successes
Use the complement rule when working with lower-tail cumulative tables.
Apply the Complement Rule
- Find P(X ≤ k-1)
- Subtract from 1
Example:
n = 5, p = 0.30, find P(X ≥ 2)
• P(X ≤ 1) = 0.528
• 1 – 0.528 = 0.472
There is a 47.2% chance of 2 or more successes.
This works because the total probability is 1. If 52.8% of outcomes have 1 or fewer successes, the remaining 47.2% must have 2 or more.
Handle P(X > k): More Than k Successes
This excludes the value k itself.
Use the Formula
- Find P(X ≤ k)
- Subtract from 1
Example:
n = 11, p = 0.40, find P(X > 0)
• P(X ≤ 0) = 0.004
• 1 – 0.004 = 0.996
So there is a 99.6% chance of at least one success.
This is useful in reliability testing, for example, “What is the chance the machine fails more than zero times?”
Compute Range Probabilities
Need the chance that successes fall between two values?
Use the Range Formula
- Find P(X ≤ b)
- Find P(X ≤ a-1)
- Subtract
Example:
n = 5, p = 0.30, find P(2 ≤ X ≤ 4)
• P(X ≤ 4) = 0.998
• P(X ≤ 1) = 0.528
• 0.998 – 0.528 = 0.470
So there is a 47.0% chance of 2, 3, or 4 successes.
Think of it as slicing a cumulative pie. Subtract the lower part to isolate the middle.
Work With Individual Probability Tables

If your table lists P(X = r), not cumulative values, adjust your strategy.
Sum Individual Values for Ranges
To find P(X ≤ 3), add P(0) + P(1) + P(2) + P(3).
Example:
n = 6, p = 0.60, find P(X < 4) which equals P(X ≤ 3)
From table:
• P(0) = 0.004
• P(1) = 0.037
• P(2) = 0.138
• P(3) = 0.276
Sum: 0.004 + 0.037 + 0.138 + 0.276 = 0.455
So a 45.5% chance of fewer than 4 successes.
Label each term as you go. This prevents skipped values and improves accuracy.
Read Upper-Tail Tables
Some tables give “at least” probabilities directly.
Direct Lookup for P(X ≥ r)
Find intersection of n, p, and r. The value is already P(X ≥ r).
Example:
Upper-tail table, n = 10, p = 0.4, find P(X ≥ 8)
Read value at r = 8: 0.012
So 1.2% chance of 8 or more successes.
Convert Upper-Tail to Other Forms
Need “less than” or “exactly” from an upper-tail table?
Find P(X ≤ k)
Use the formula: 1 – P(X ≥ k+1)
Example: Find P(X ≤ 8) when n = 10, p = 0.4
• Look up P(X ≥ 9) = 0.002
• 1 – 0.002 = 0.998
Find P(X = k)
Use the formula: P(X ≥ k) – P(X ≥ k+1)
Example: P(X = 8)
• P(X ≥ 8) = 0.012
• P(X ≥ 9) = 0.002
• 0.012 – 0.002 = 0.010
Find Range P(a ≤ X ≤ b)
Use the formula: P(X ≥ a) – P(X ≥ b+1)
Example: P(2 ≤ X ≤ 5)
• P(X ≥ 2) = 0.994
• P(X ≥ 6) = 0.232
• 0.994 – 0.232 = 0.762
With upper-tail tables, subtract higher thresholds to isolate lower ranges.
Apply in Real Scenarios
:max_bytes(150000):strip_icc()/DDM_INV_binomial-distribution_df-530704a61bc2464c8e7deb71e9deb5ae.jpg)
Let us see how binomial tables solve practical problems.
Case 1: Multiple Choice Guessing
A quiz has 5 questions (n=5), each with 5 choices. Probability of guessing right: p = 0.20
Question: What is the chance of getting 3 or fewer correct?
Answer: P(X ≤ 3) = 0.993 (99.3%)
Question: What is the chance of passing (4 or 5 correct)?
Answer: P(X ≥ 4) = 1 – P(X ≤ 3) = 1 – 0.993 = 0.007 (0.7%)
Random guessing rarely leads to passing.
Case 2: Slot Machine Wins
Win rate: p = 0.30, plays: n = 5
Question: Win at most 3 times?
Answer: P(X ≤ 3) = 0.969
Question: Win exactly 4 times?
Answer: P(X=4) = P(X≤4) – P(X≤3) = 0.998 – 0.969 = 0.029
Case 3: Genetics
Probability a child inherits a trait: p = 0.25, family size: n = 8
Question: Exactly 2 children have it?
Answer: Use individual table, r = 2: 0.311 (31.1%)
Verify With Excel
Tables are limited. Use Excel for precision or unlisted values.
Use BINOM.DIST Function
Syntax:
=BINOM.DIST(number_s, trials, probability_s, cumulative)
• number_s: k
• trials: n
• probability_s: p
• cumulative: TRUE for P(X ≤ k), FALSE for P(X = k)
Example:
Exactly 4 successes in 20 trials, p = 0.25:
=BINOM.DIST(4, 20, 0.25, FALSE) = 0.1897
Matches table-derived value of approximately 0.190.
Excel handles non-standard p values (for example, 0.17) and large n (up to 1000).
Avoid Common Mistakes
Even smart users trip up on these errors.
Mistake 1: Using Wrong Table Type
Error: Assuming all tables are cumulative.
Fix: Always verify the header. If it says P(X = x), do not subtract. Sum instead.
Mistake 2: Confusing “Less Than” and “At Most”
• P(X < 3) = P(X ≤ 2)
• P(X ≤ 3) = P(X < 4)
Rewrite inequalities in “≤” form before looking up.
Mistake 3: Forgetting Integer Constraints
Binomial distributions are discrete. There is no P(X = 2.5). Always use whole numbers for k.
Mistake 4: Misreading Rows and Columns
Some tables list p as rows, n as sections. Double-check orientation.
Quick Check: Does P(X ≤ 0) equal (1-p)^n? If yes, you are reading correctly.
Master Key Patterns
Once you have practiced, look for these shortcuts.
Symmetry in p = 0.50 Tables
When p = 0.50, the distribution is symmetric. P(X = 2) for n=8 equals P(X = 6).
High p vs Low p Mirroring
For p = 0.30 and p = 0.70, values mirror. P(X = 2) at p=0.30 approximately equals P(X = 6) at p=0.70 (since 6 failures = 2 successes).
Useful when your p is not listed in the table.
Frequently Asked Questions About Using Binomial Tables
What is a binomial table used for?
A binomial table provides pre-calculated probabilities for binomial distributions. It helps you find the probability of a specific number of successes in a given number of trials without using the binomial formula repeatedly.
How do I read a binomial probability table?
Locate your number of trials (n) in the table section, find the column for your success probability (p), and read the value at the row for your target number of successes (k). The value you find depends on the table type (cumulative, individual, or upper-tail).
What is the difference between P(X ≤ k) and P(X = k)?
P(X ≤ k) gives the probability of k or fewer successes (cumulative). P(X = k) gives the probability of exactly k successes. If you have a cumulative table and need an exact value, subtract P(X ≤ k-1) from P(X ≤ k).
Can I use a binomial table for any probability value?
No. Binomial tables typically include specific p values (for example, 0.05, 0.10, 0.15). For p values not listed, use software like Excel or a calculator. Very large n values may also exceed table limits.
How do I find “at least” probabilities using a cumulative table?
Use the complement rule. P(X ≥ k) = 1 – P(X ≤ k-1). Find the cumulative probability for one less than your target, then subtract from 1.
What if my table shows upper-tail probabilities (P(X ≥ r))?
You can convert them. For P(X ≤ k), use 1 – P(X ≥ k+1). For exact probabilities, subtract adjacent upper-tail values: P(X = k) = P(X ≥ k) – P(X ≥ k+1).
Key Takeaways for Using Binomial Tables
Binomial tables save time, but only if you know how to use them correctly. Always start by identifying the table type (cumulative, individual, or upper-tail) because using the wrong type is the most common source of errors. Once you know the table format, translate your question into mathematical notation. For example, “at least” becomes ≥, “at most” becomes ≤, and “exactly” requires subtraction or summation depending on your table type. With practice, you will move from confusion to confidence in under 10 minutes. Keep this guide handy, and soon you will not need it at all.